PropagandaScope

Data card 01

Is a watchword on the rise or in decline?A question raised by Qian Gang in Watchwords (2012)

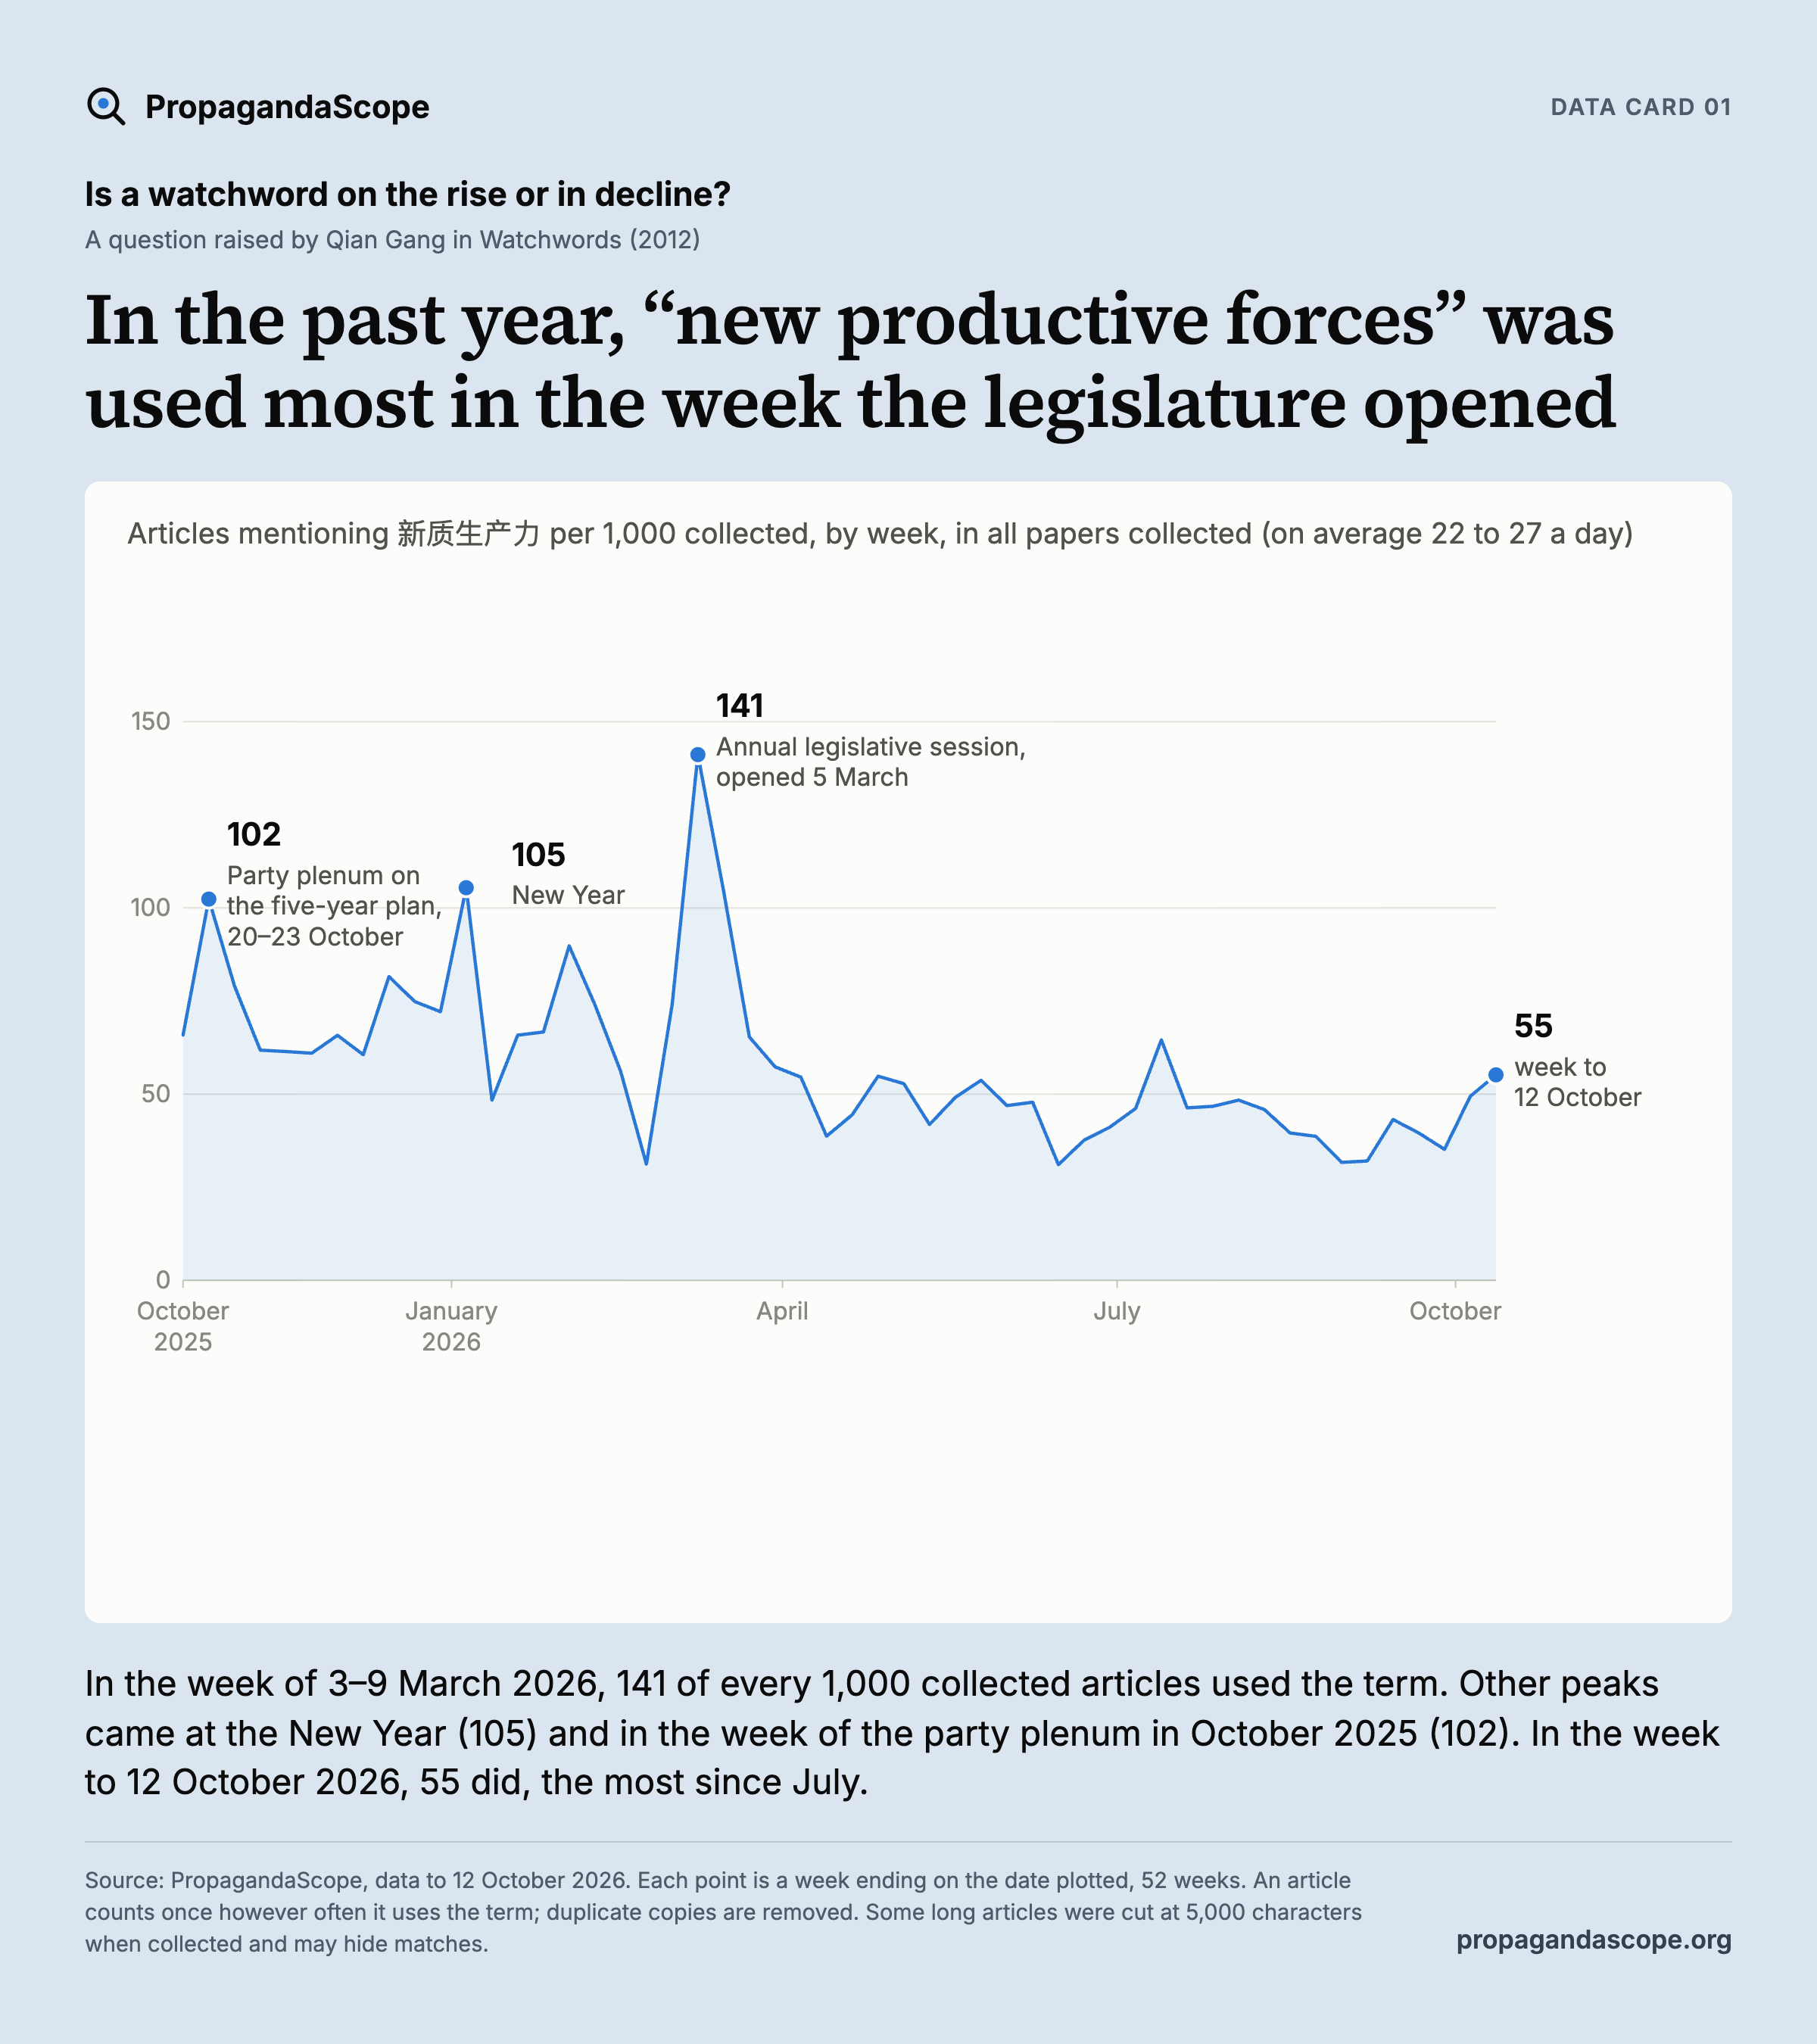
In the past year, “new productive forces” was used most in the week the legislature opened

Articles mentioning 新质生产力 per 1,000 collected, by week, in all papers collected (on average 22 to 27 a day)

501001500Oct2025Jan2026AprJulOct102Party plenum onthe five-year plan,20–23 October105New Year141Annual legislative session,opened 5 March55week to12 October501001500October2025January2026AprilJulyOctober102Party plenum onthe five-year plan,20–23 October105New Year141Annual legislative session,opened 5 March55week to12 October

In the week of 3–9 March 2026, 141 of every 1,000 collected articles used the term. Other peaks came at the New Year (105) and in the week of the party plenum in October 2025 (102). In the week to 12 October 2026, 55 did, the most since July.

Source: PropagandaScope, data to 12 October 2026. Each point is a week ending on the date plotted, 52 weeks. An article counts once however often it uses the term; duplicate copies are removed. Some long articles were cut at 5,000 characters when collected and may hide matches.
Research sources: Qian Gang (2012), Watchwords (PDF)

Event sources

View the data
WeekMatching articlesArticles collectedPer 1,000Papers collected a day
6–12 October 20263105,61955.224.4
29 September – 5 October 20262565,18349.424.3
22–28 September 20262426,88635.124.7
15–21 September 20263097,81439.524.7
8–14 September 20263287,59543.224.7
1–7 September 20262367,36932.024.7
25–31 August 20262377,48431.724.7
18–24 August 20262877,42438.724.7
11–17 August 20262887,28239.524.7
4–10 August 20263377,34745.924.7
28 July – 3 August 20263757,74948.424.9
21–27 July 20263597,68846.724.7
14–20 July 20263527,60246.324.7
7–13 July 20264847,49764.624.7
30 June – 6 July 20263367,28546.124.7
23–29 June 20263127,58641.125.1
16–22 June 20262657,04337.625.7
9–15 June 20262467,92531.025.7
2–8 June 20263777,88347.825.1
26 May – 1 June 20263998,50246.925.7
19–25 May 20264358,09853.726.3
12–18 May 20264058,24449.126.4
5–11 May 20263107,41241.826.6
28 April – 4 May 20263666,93052.826.4
21–27 April 20264778,70254.826.7
14–20 April 20263798,52144.526.7
7–13 April 20263278,45138.726.7
31 March – 6 April 20264408,06654.526.6
24–30 March 20264838,42557.326.7
17–23 March 20265007,65465.325.4
10–16 March 20266746,450104.523.7
3–9 March 20269836,965141.124.0
24 February – 2 March 20264866,56674.023.7
17–23 February 2026922,95231.222.3
10–16 February 20263476,18556.123.7
3–9 February 20265627,59574.023.7
27 January – 2 February 20267017,80889.823.7
20–26 January 20264897,33766.623.9
13–19 January 20264817,31065.823.7
6–12 January 20263637,50648.423.7
30 December 2025 – 5 January 20265885,579105.423.3
23–29 December 20255077,03072.122.9
16–22 December 20255407,21674.822.9
9–15 December 20255867,18881.522.9
2–8 December 20254437,31660.622.9
25 November – 1 December 20254897,43565.822.9
18–24 November 20254497,36561.022.9
11–17 November 20254427,19761.422.9
4–10 November 20254507,28261.822.9
28 October – 3 November 20255567,04079.022.9
21–27 October 20256786,623102.422.4
14–20 October 20254326,56065.922.4

Download imageData to 12 October 2026. Updates will be published as separately dated cards.